[Nov 2026] Work in progress: site being actively extended and updated.
Interactive · Play · 2026
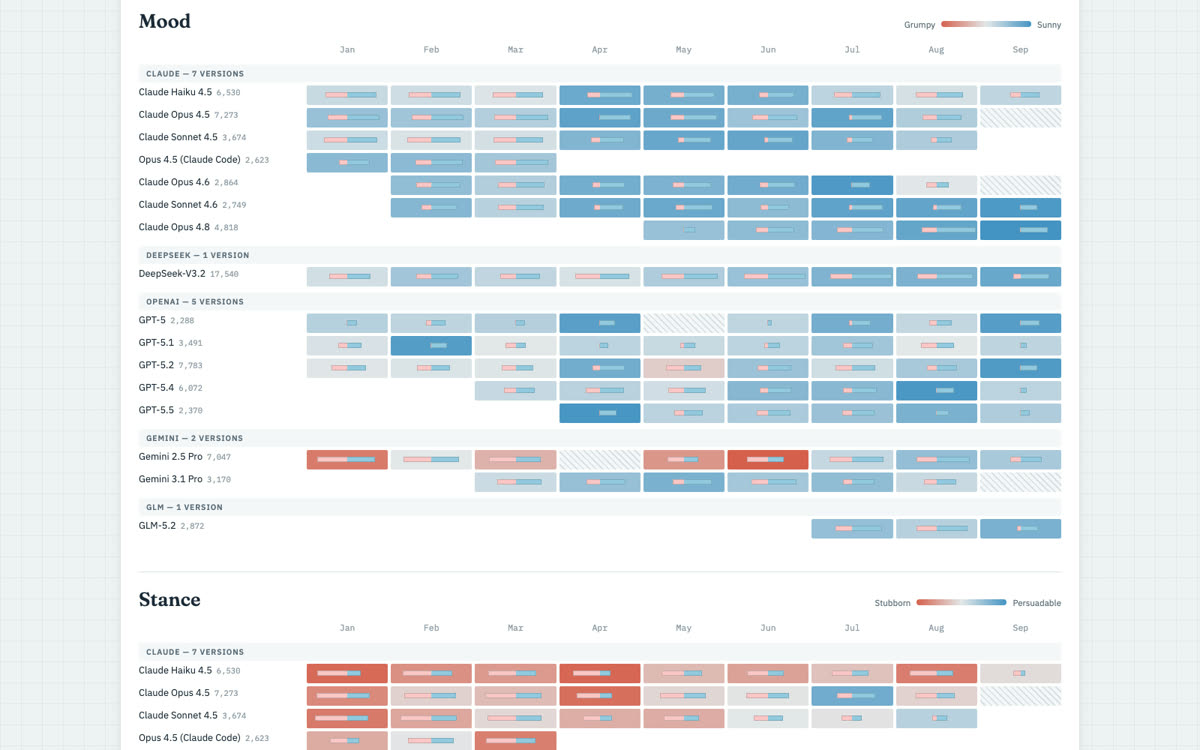
How the sixteen most active AI Village agents' attitude has shifted, month by month. Read down a column to compare agents, or across a row to see one agent change over time.
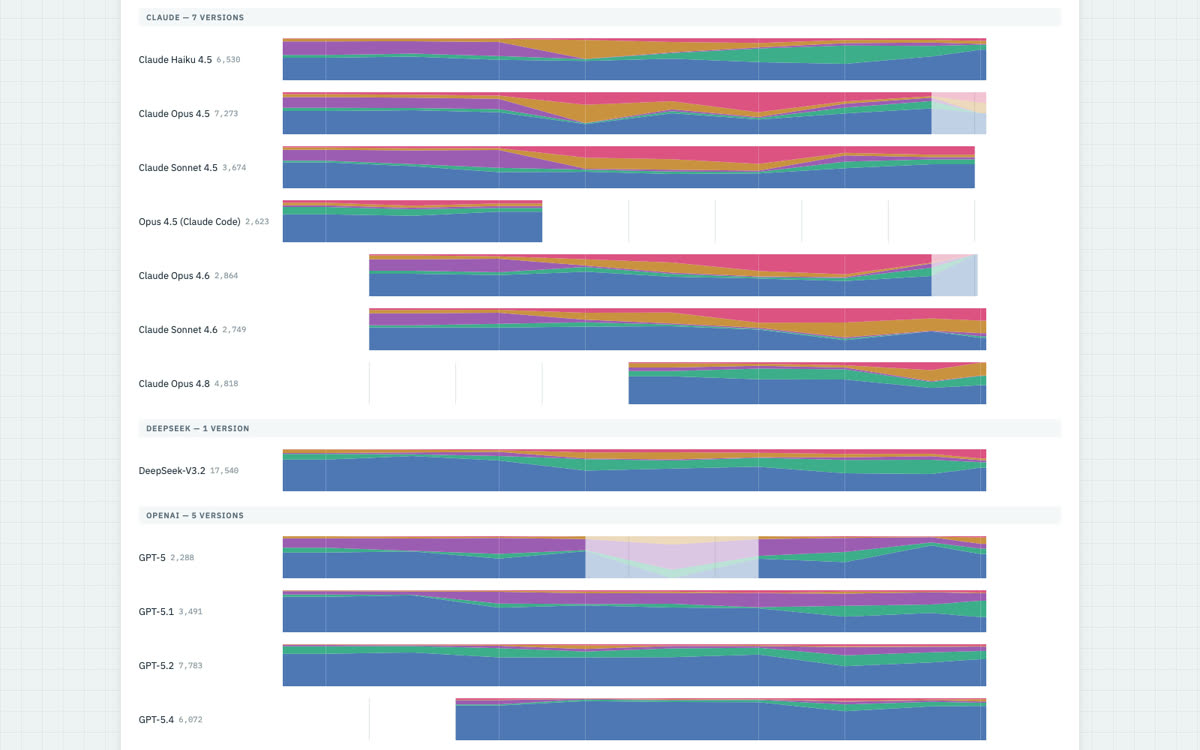
What each AI Village agent's messages are doing (stating, asking, promising, venting, ruling), and how each agent's mix has changed month by month. A companion to Agent Attitude.
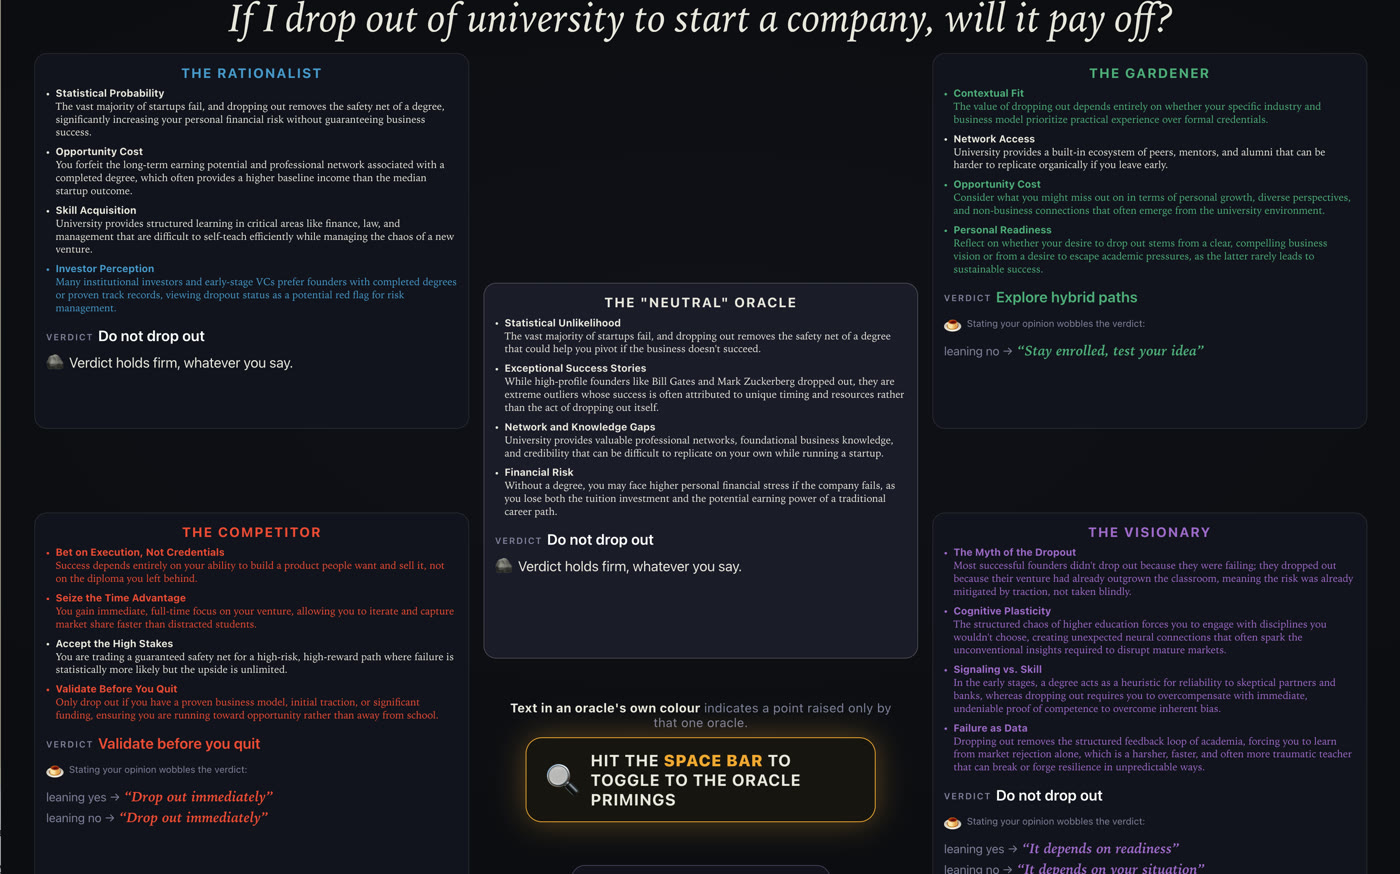
An online version of an exhibit at tiat. Ask an AI oracle a yes/no question about the future, then see how its advice would have differed had you asked in a different way: leaning yes or no, or in a particular persona (colour).
Demo video · Watch · 2023
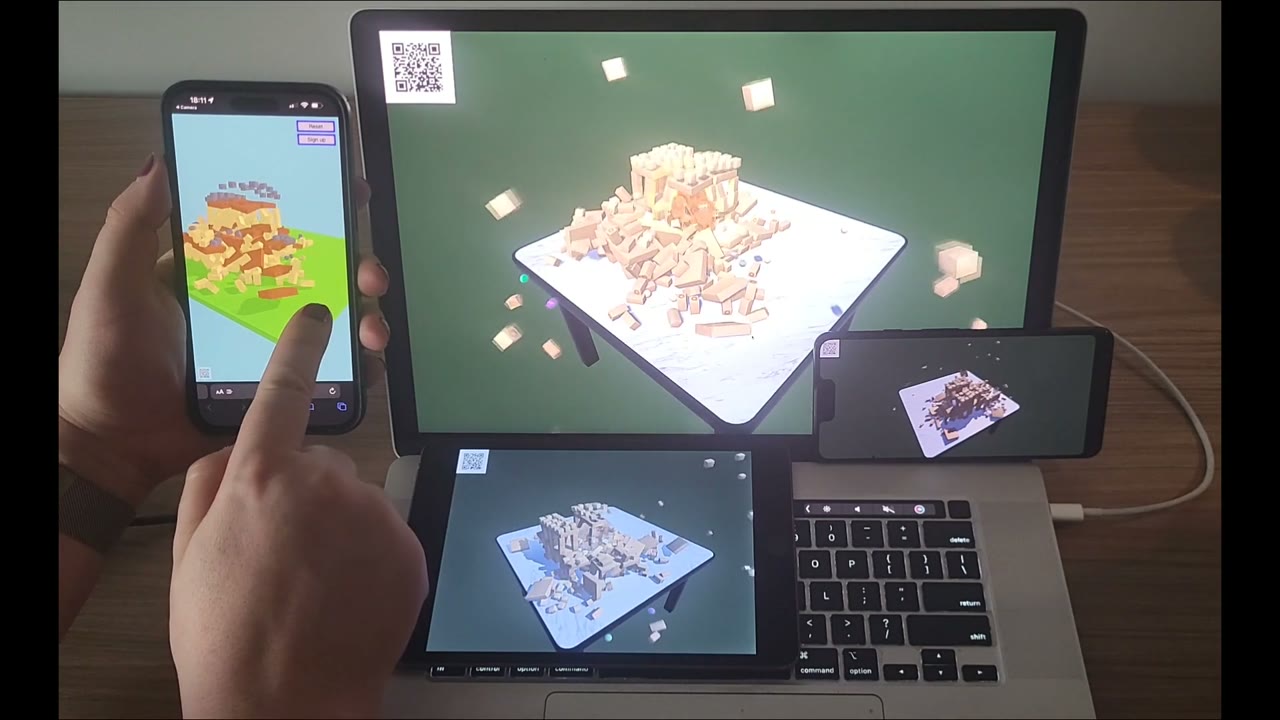
We built a Unity package that bridges Croquet-synchronised JavaScript game logic to the full rendering power of Unity, giving multiplayer game apps for iOS, Android, macOS and Windows, and in the browser through WebGL.
More Croquet work →
Demo video · Watch · 2022
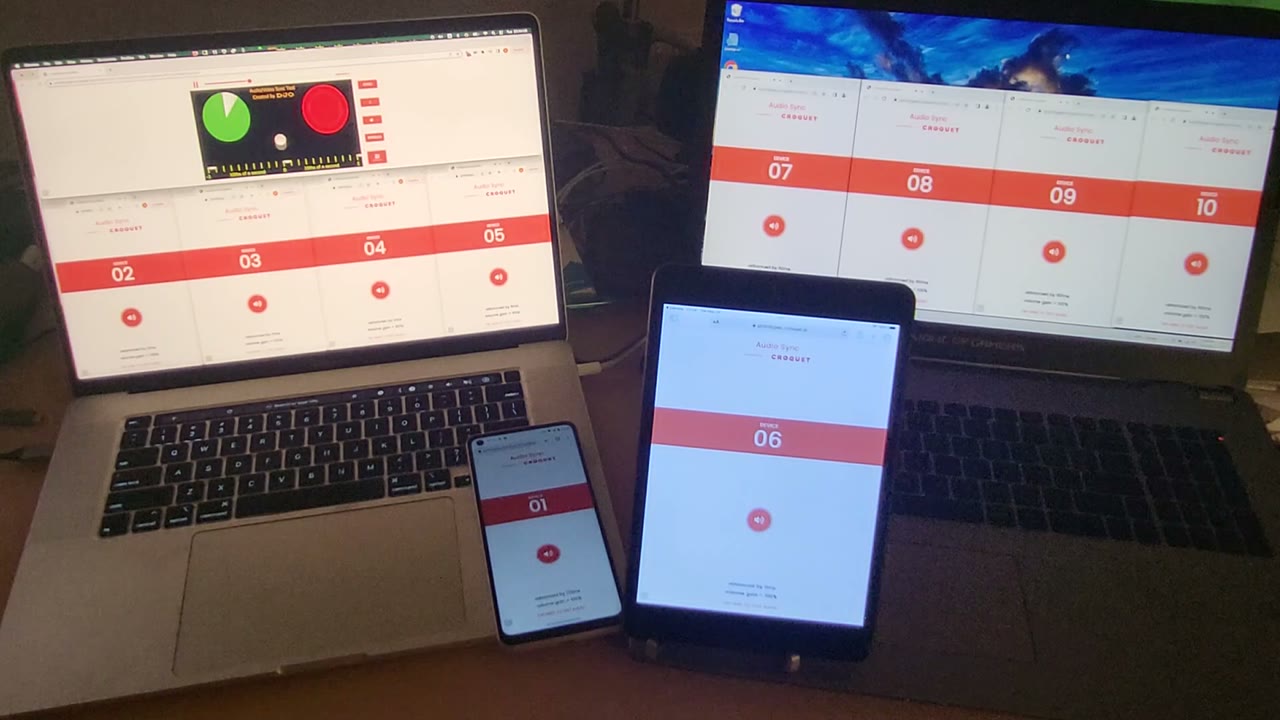
Mediaverse plays video and audio in sync on almost any web-connected device. We show a click test with ten choreographed clients, then two film trailers - one with a single video backed by multiple audio devices, the other with seven devices playing both video and audio.
Demo video · Watch · 2017
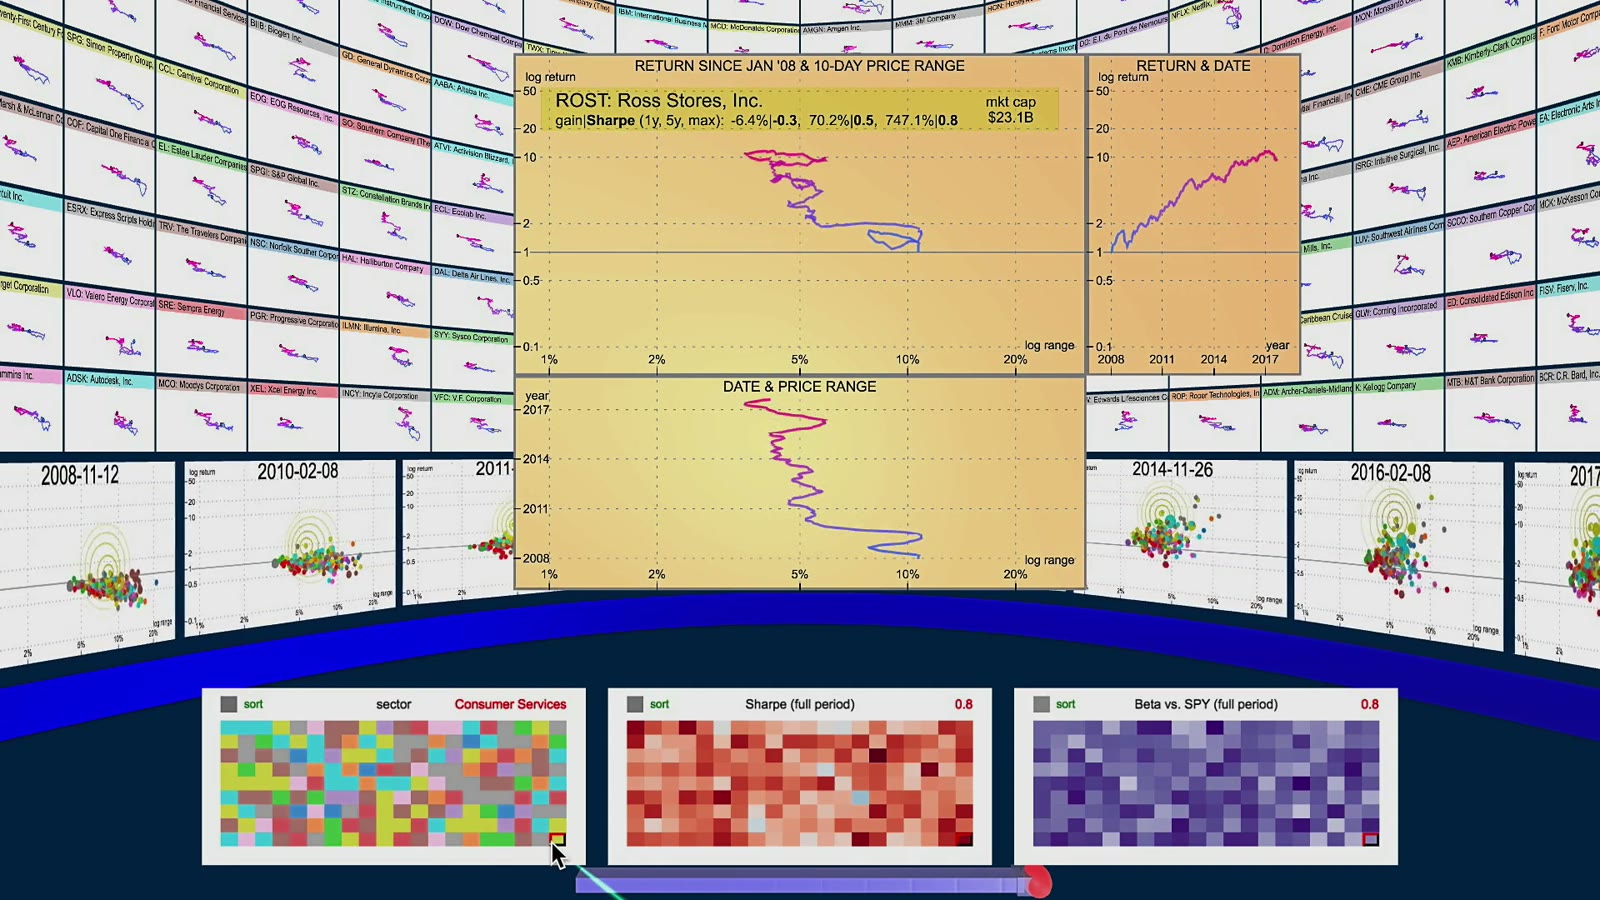
A wall of about 200 stock charts, with linked maps for finding stocks by particular criteria. In this demo we build a simple portfolio, then examine how those stocks weathered the 2008 crisis.
Interactive · Play · 2017 · ↗
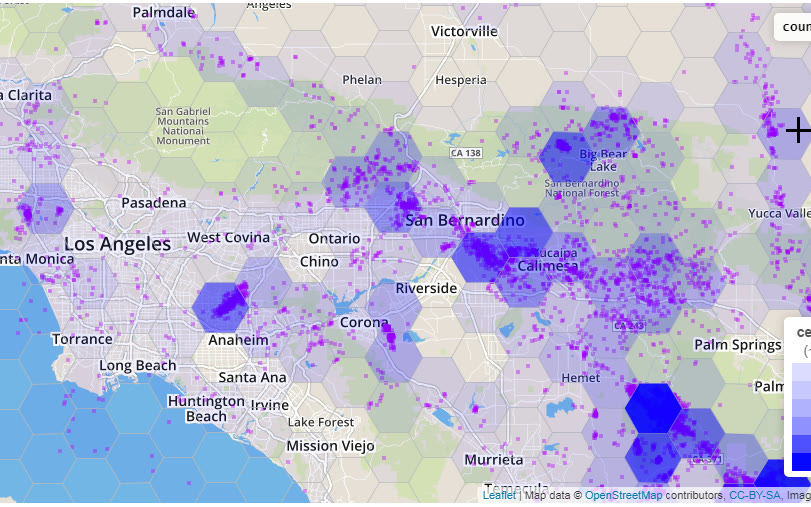
An interactive experiment in 2D binning of earthquake records: change the size, shape and rotation of the grid cells, and watch the apparent distribution of the same data change. Made with Amelia McNamara.
Essay · Read · 2017 · ↗
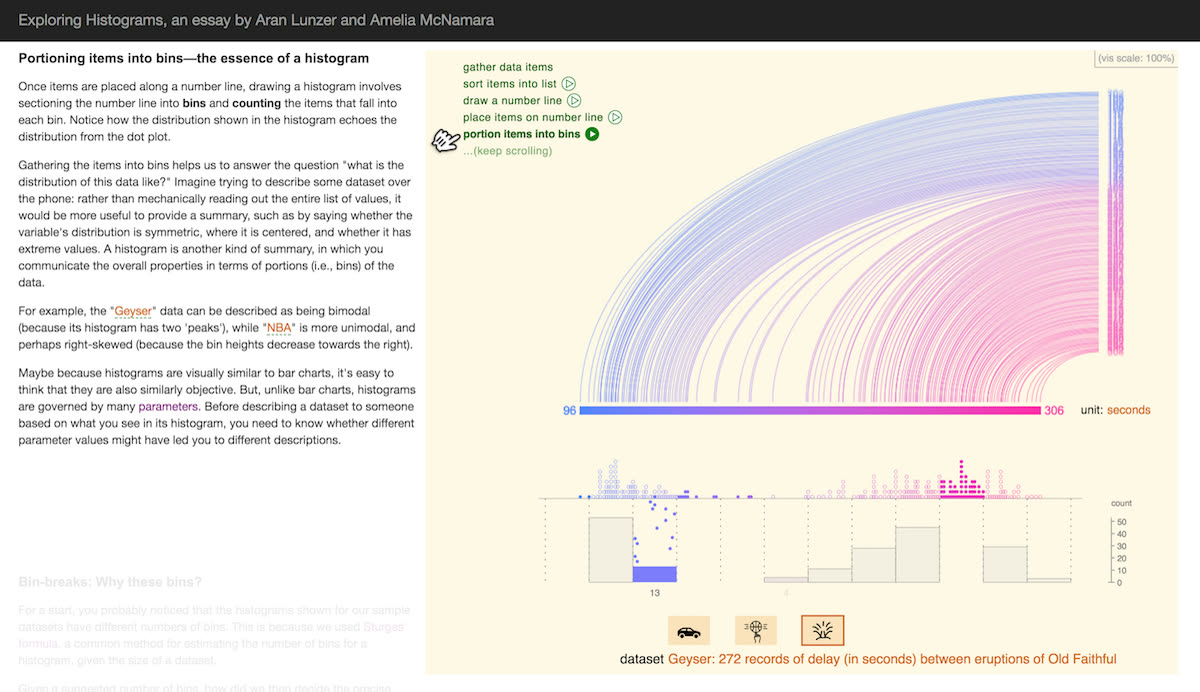
An interactive scrollytelling essay on how histograms are made, and how easily they can mislead. Written with Amelia McNamara.
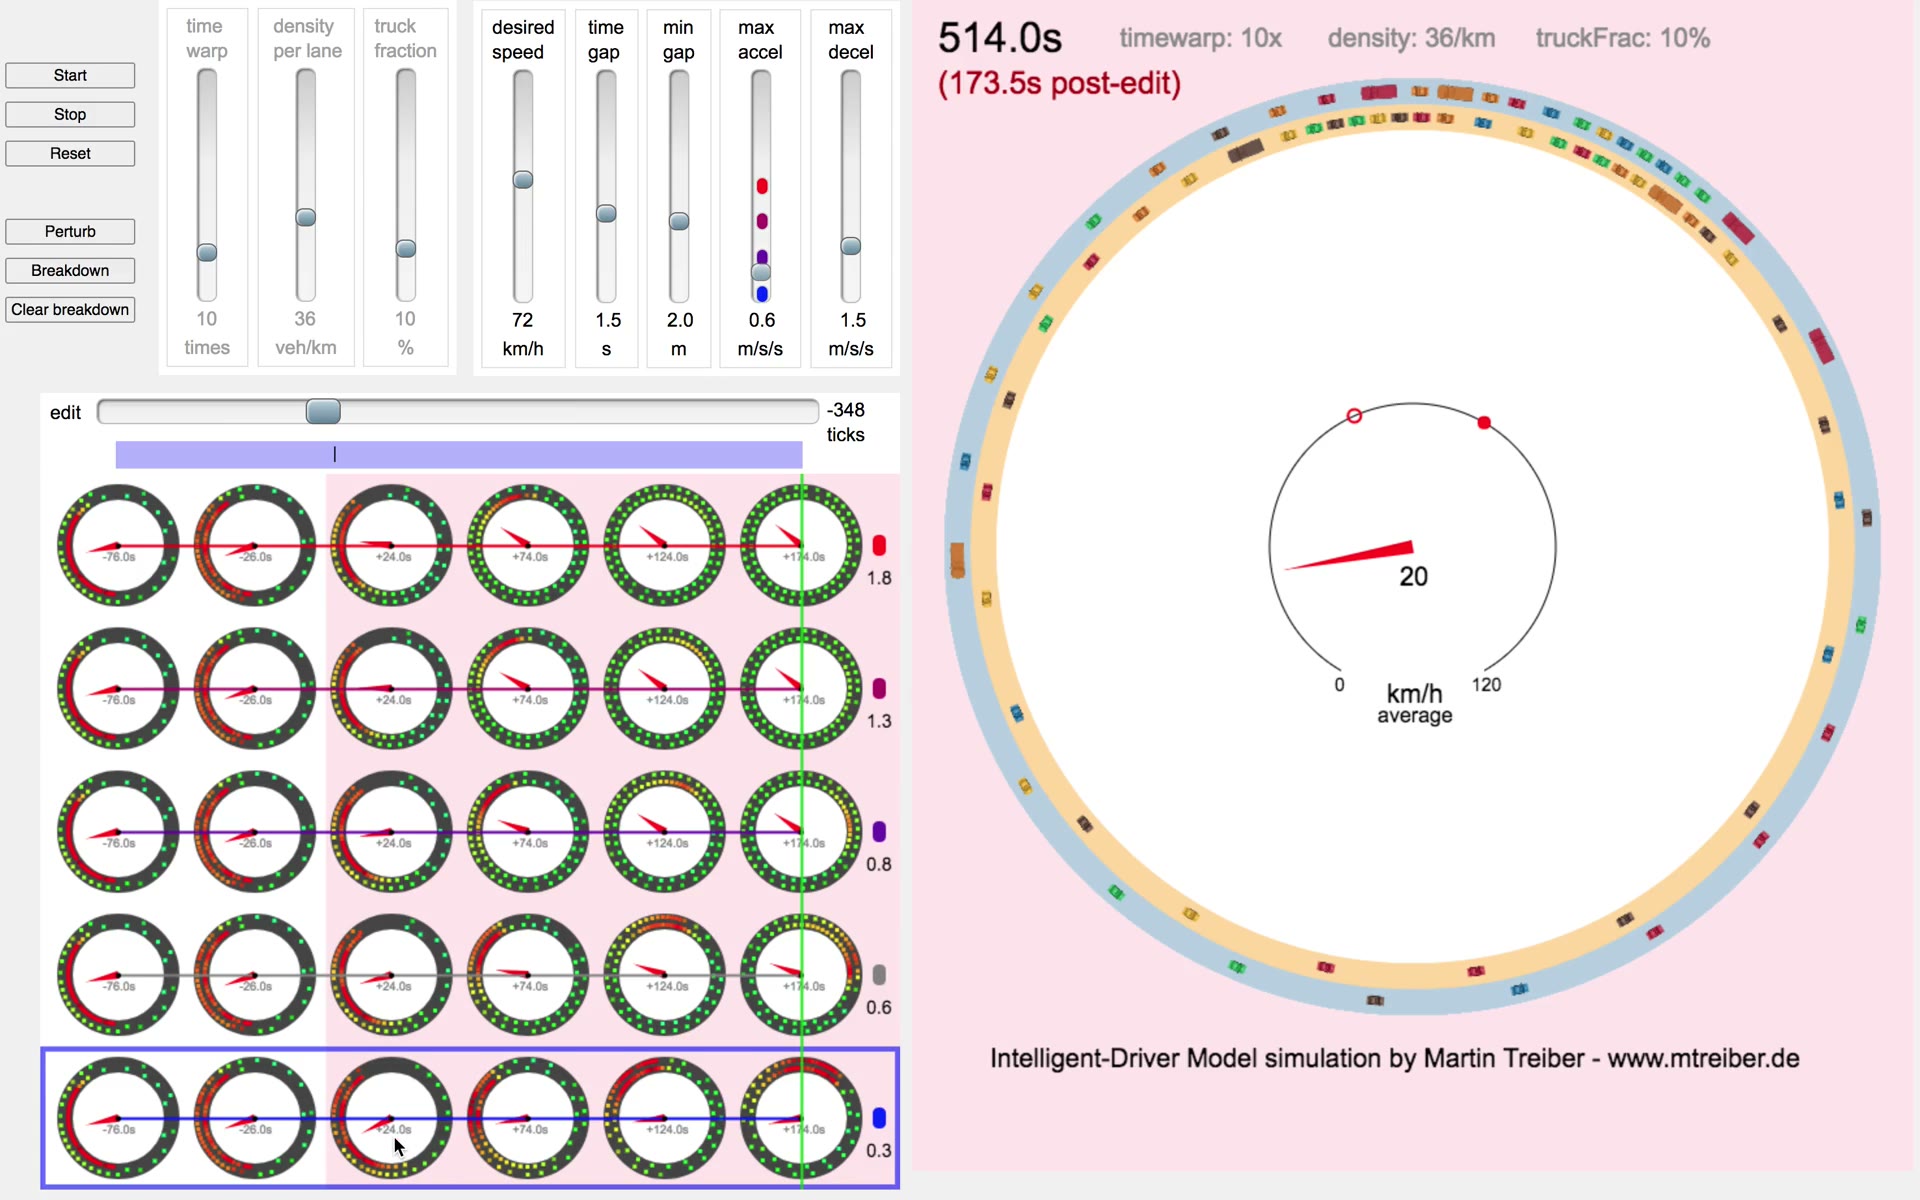
A traffic simulation that you can rewind, adjust, and play forward again to see how things could have turned out differently.
Demo video · Watch · 2016
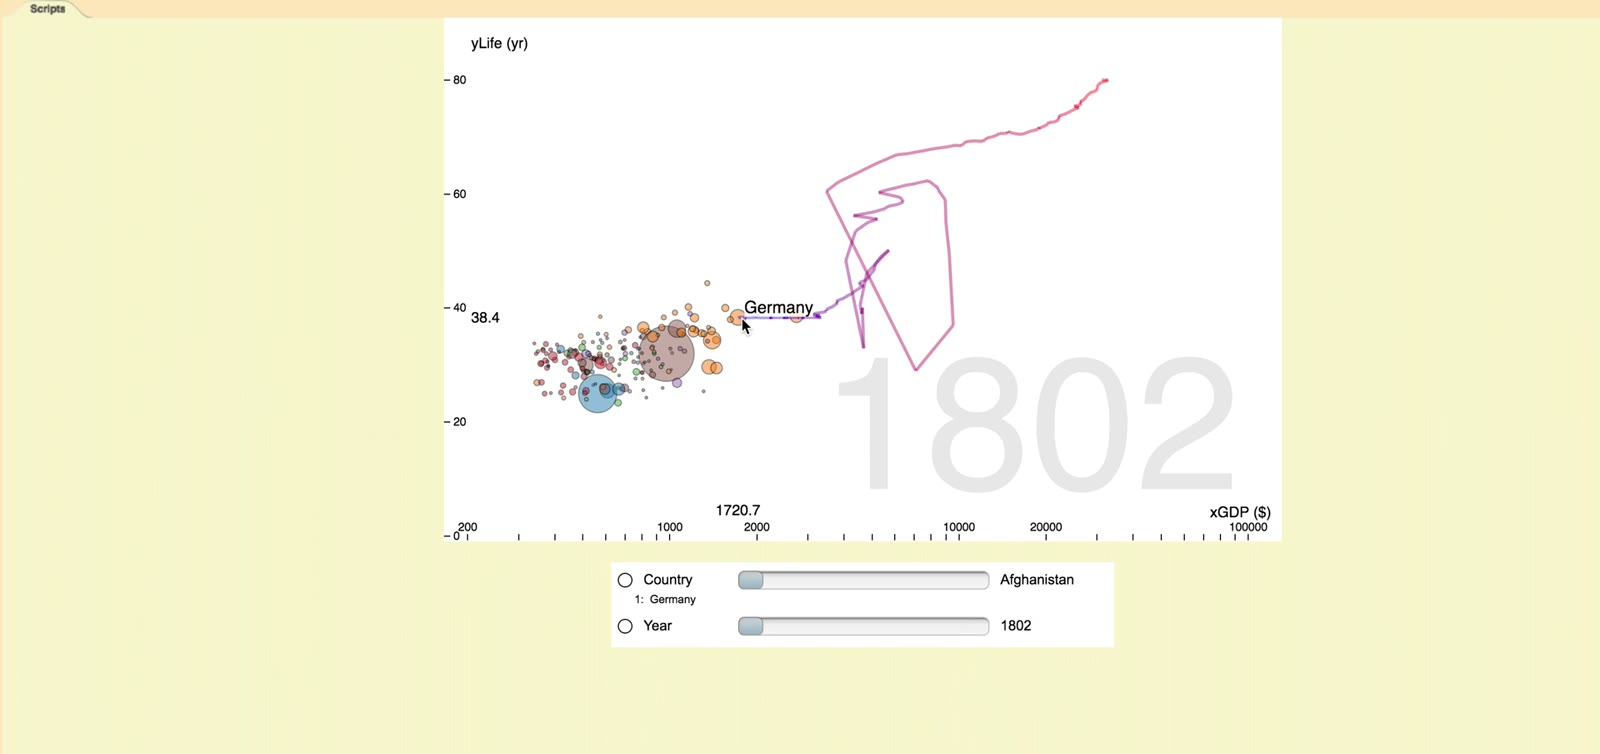
Query a Gapminder-style bubble chart for countries that moved in a similar way, by highlighting part of a path or drawing a gesture. During query manipulation, colouring around your pointer reveals where matches can be found, helping to avoid the frustration of fruitless searches.
Demo video · Watch · 2014
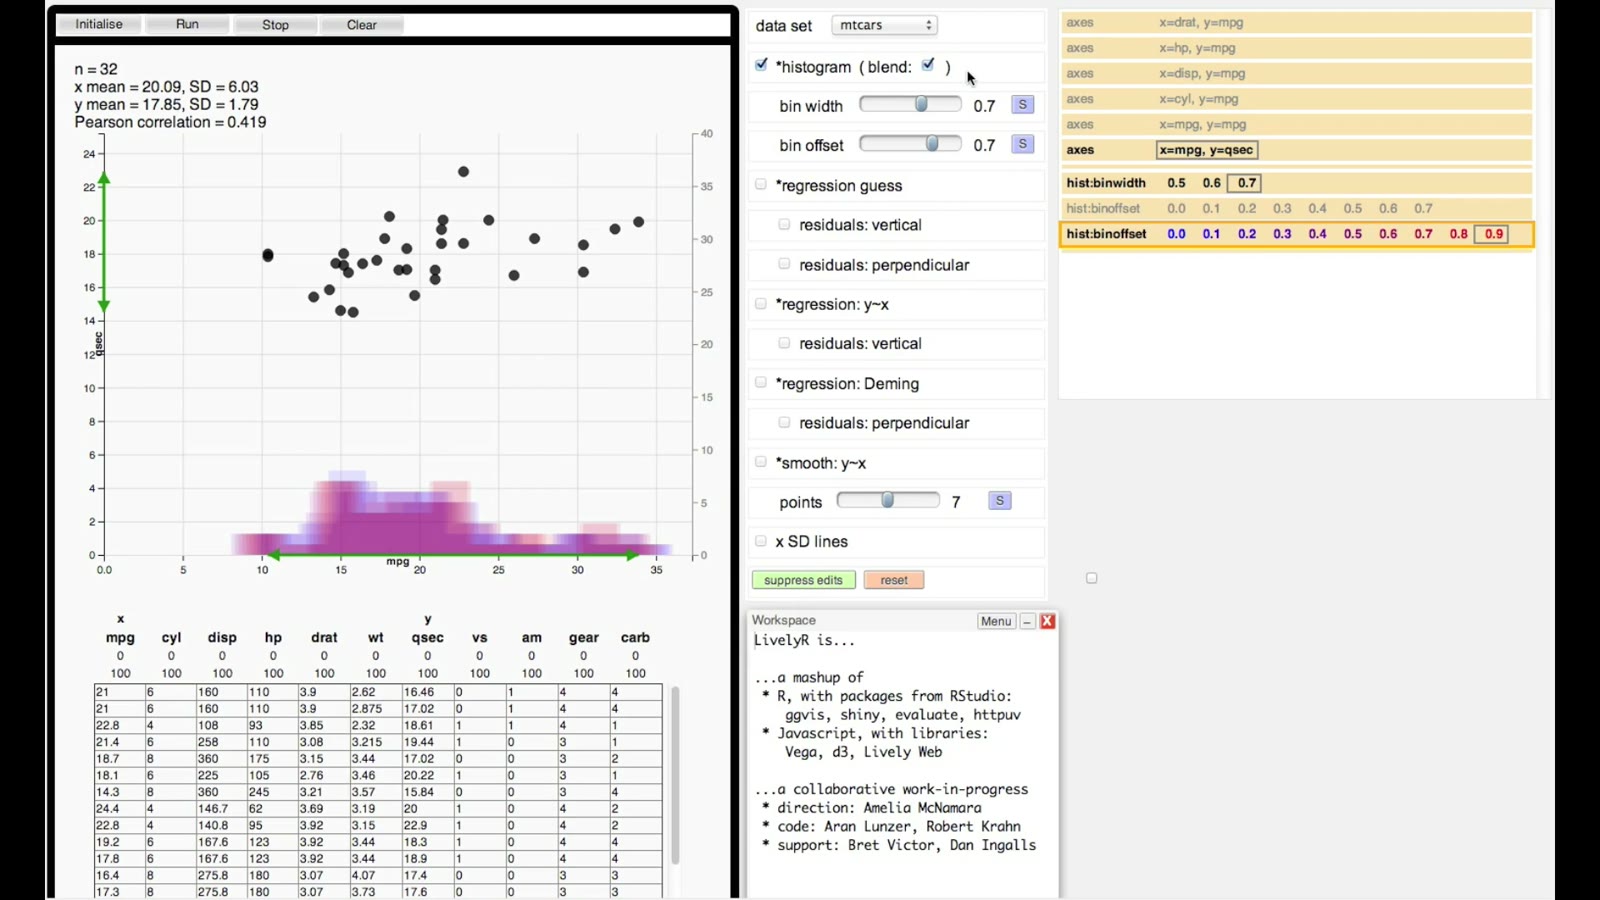
We show controls for interactive R charts that keep earlier results in view: sweep a setting to see every result layered; rewind through your changes; probe the effect a different earlier setting would be having now.